 GeoData.NZ
GROUND STATIONS
Type of resources
Topics
Keywords
Contact for the resource
Provided by
Years
Update frequencies
status
-
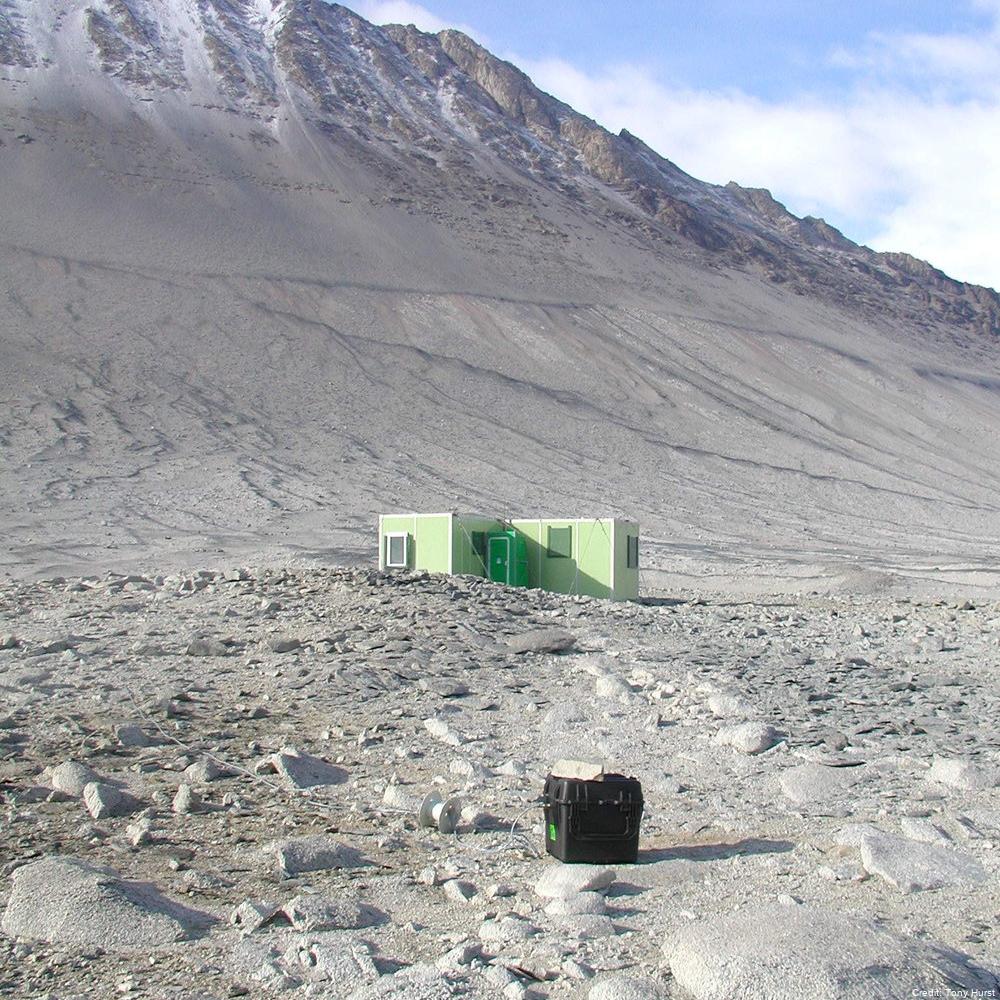
A tide gauge was installed in November 1990 and has been in near continuous operation since. A 10 minute average of water depth was recorded each hour with hourly averages of wind speed and direction, air temperature and solar radiation. From 2000 the recording frequency was increased from every hour to every 10 minutes. From 2003 data is read every 10 seconds and an average value (from 60 readings) is calculated every 5 minutes and recorded. Barometric pressure was measured as well, starting in 2003, with six barometric pressure readings made between 2 and 3 minutes in the 5-minute interval and averaged and recorded with the tide value. Each year the rise and fall of the sea ice is observed over a 2 - 3 day period during a spring tide using GPS. These measurements are related to a tide gauge bench mark and the sea surface to enable the reliability of the tide gauge to be checked. The tide gauge data is archived by Land Information New Zealand. GET DATA: https://sealevel-data.linz.govt.nz/index.html?tidegauge=ROBT
-
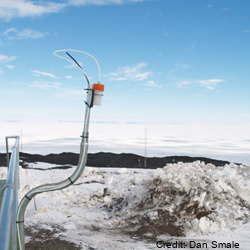
Ultraviolet radiation measurements over the spectral region 290-450 nm with a high precision spectro-radiometer. The spectro-radiometer was installed at Arrival Heights as a two month (November 2006 – January 2007) blind inter-comparison with the established measurement programme run by Biospherical Instruments for the USAP. The data was compared with the USAP data taken simultaneously. These data are held internally by NIWA. GET DATA: contact dan.smale@niwa.co.nz
-

A sea level recorder and barometer was installed at Scott Base in January 2001 initially to support oceanographic and hazards research (including tsunami) and to support hydrographic surveying. The sea-level recorder is a nitrogen bubbler system with a paroscientific pressure transducer located on a bottom-mounted spigot of the osmosis boom (to enable lifting for maintenance), that ensures the orifice always returns to the same point. Sea level and atmospheric pressure and temperature are recorded at 5 minute intervals and stored every 24 hours. Each year the rise and fall of the sea ice is observed over a 2-3 day period during a spring tide using GPS. These measurements are related to a tide gauge benchmark and the sea surface to enable the reliability of the tide gauge to be checked. GET DATA: https://sealevel-data.linz.govt.nz/index.html?tidegauge=SCOT
-
Measurements of chlorine monoxide (ClO) made with a Microwave Chlorine Monoxide Millimeter Wave Spectrometer (ground-based). The instrument (ClOe1) was established in January of 1996 at Scott Base and decommissioned in October 2023. A replacement radiometer (ClOe4) was installed at Scott Base in February 2023 (an overlap in the data for timeseries continuity purposes). These data are produced in collaboration with State University of New York (SUNY) Stoney Brook and Naval Research Laboratory (NRL). “Raw” data are times and recorded microwave emission spectra. “Derived” data are column amounts and vertical profile information of chlorine monoxide (ClO). The instrument has acquired the nickname "CloeTechnique" for vertical profile information uses "optimal estimation" to extract information from pressure broadening of ClO emission line. Significant failure in early 2018 only fixed in November 2018. No data in the July - October 2018 period. Data is held at NRL and in the NDACC database. Data are available as monthly .ndm files, and additional metadata are available in the header. Instrument timeline: - ClOe1 1996-2023 - ClOe4 2023 – present GET DATA: https://www-air.larc.nasa.gov/missions/ndacc/data.html?station=scott.base#
-
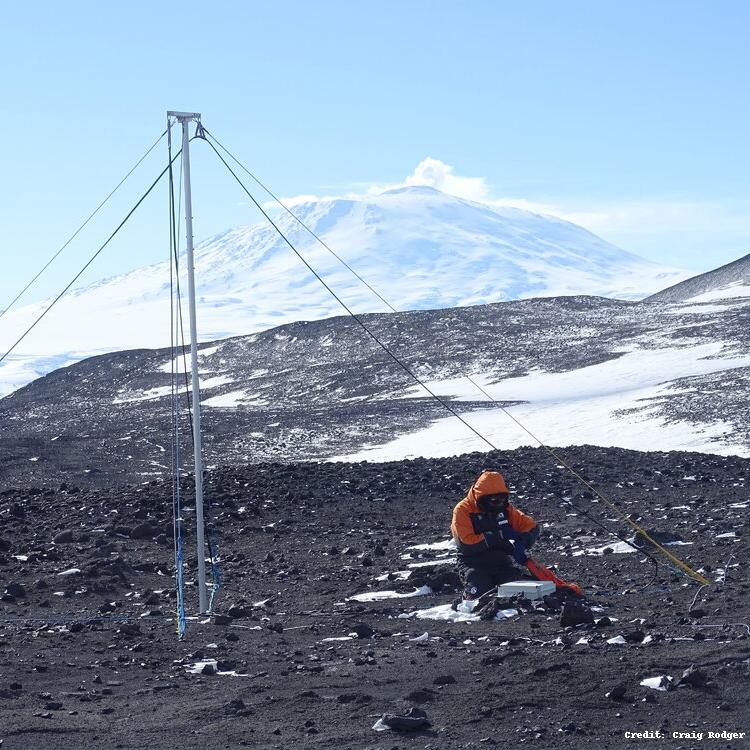
The WWLLN Very Low Frequency (VLF) Radio Sensor was installed at Scott Base in November 2015 by Dr. James Brundell and Ms. Emma Douma as part of Antarctica New Zealand Event K060-1516-A. The sensor measures the electric field in the Very Low Frequency radio range (~500 Hz-50 kHz) and passes it to a PC which processes the data for the experiments. The antenna is located behind the Hatherton lab. It was installed due to increasing manmade electromagnetic noise levels in the "quiet zone" at Arrival Heights. The observations from this antenna are now the primary WWLLN feed from Ross Island, the Arrival Height's magnetic field antenna is now a backup. WWLLN, uses the VLF feed but processes it to detect the radio-wave pulses from lightning. WWLLN observations are sent to a central processing computer to determine the time and location of lightning pulses all over the globe. The World Wide Lightning Location Network (WWLLN) is an experimental Very Low Frequency (VLF) network of sensors being developed through collaborations with research institutions across the globe. The network exploits the considerable electromagnetic power radiated by lightning as "sferics" present in the VLF band. By combining radio-pulse observations from at least 5 stations, the WWLLN central processing computers can determine the location of the original lightning discharge. As the radio-pulse observations are immediately sent back across the internet to the central processing computers locations are generated within ~10 s of the discharge, and thus near real time. There are currently about 70 active VLF receiving stations operating in the VLF World-Wide Lightning Location Network, including the Scott Base measurements. WWLLN observations are continuously transmitted to one of the WWLLN primary servers, in this case flash.ess.washington.edu at the University of Washington, Seattle, USA. GET DATA: https://space.physics.otago.ac.nz/aarddvark/
-
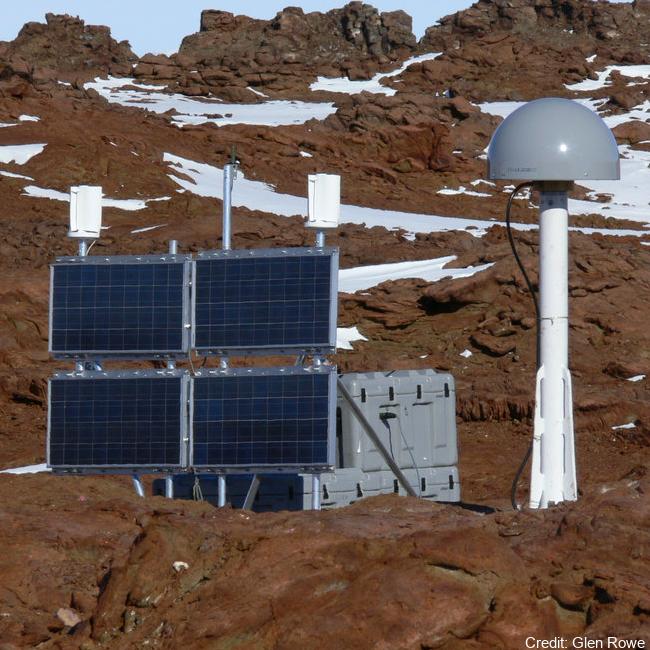
The network collects Global Navigation Satellite System (GNSS) data for the purposes of monitoring the New Zealand Geodetic Datum 2000 (NZGD2000), updating the national deformation model, and maintaining New Zealand’s relationship to the International Terrestrial Reference Frame (ITRF). Antarctic GNSS data form part of the New Zealand campaign GNSS (Global Navigation Satellite System) surveys. Data have been collected by periodic campaign style GNSS surveys. High accuracy continuous Global Positioning System tracking stations in Antarctica: - Scott Base (SCTB - LINZ Geodetic Code) and was operational as of 29 October 2004. - Butcher Ridge (BURI- LINZ Geodetic Code) on 7 December 2007. - Minna Bluff (MIN0- LINZ Geodetic Code) on 31 January 2007. - Cape Roberts (ROB4- LINZ Geodetic Code) on 29 November 2005. Data are available in Receiver Independent Exchange Format (RINEX) files at 30 or 15 seconds sampling rate. GET DATA: https://www.geodesy.linz.govt.nz/positionz/?page=text GET DATA: https://www.linz.govt.nz/products-services/geodetic/positionz/positionz-real-time-service
-
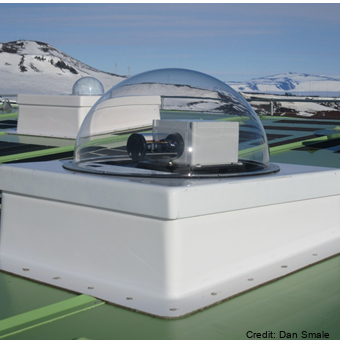
Spectroscopic measurements of stratospheric gases Nitrogen Dioxide (NO2), Chlorine Dioxide (OCIO), Bromine Oxide (BrO) and Ozone (O3) using scattered sunlight. Airyx and Envimeas: A dual MAX-DOAS UV/visible wavelength diode array spectrometer is deployed to measure of ozone (O3), nitrogen dioxide (NO2), chlorine dioxide (OClO) and bromine oxide (BrO). The instrument is a similar instrument to that of EnviMeas, and produces overlapping datasets with ADAS-2. Fixed azimuth direction, same as the Antarctic Diode Array spectrometer. System 2 (ADAS-2). The data are currently being held internally by NIWA. “Raw” data are times and recorded spectra of scattered light for several viewing directions. “Derived” data are column amount of NO2, OClO, BrO and O3, which can be split into tropospheric and stratospheric parts. This technique is sometimes referred to as MAX-DOAS Multiple-Axis Dual Optical Absorption Spectrometry. This work is carried out in collaboration the University of Heidelberg. ADAS2, Envimeas and Airyx measurements: UV/visible Multi-Axis Differential Optical Absorption Spectroscopy (MAX-DOAS) diode array spectrometers making measurements of ozone (O3), nitrogen dioxide (NO2), chlorine dioxide (OClO) and bromine oxide (BrO). JY: A scanning grating UV/Vis monochromator taking measurements of total slant column of NO2 and Ozone using scattered zenith sunlight. ADAS: A CCD grating UV/Vis grating Acton spectrometer making measurements of total slant column NO2, BrO, OClO and ozone made using scattered light zenith sunlight. Pandora: Direct sun UV/Vis measurements of ozone and NO2. Campaign to test feasibility of long term deployment at Arrival Heights. Instrument timeline JY: 1982 -2023 ADAS: 1993 - 2017 ADAS2: 1998 - present Pandora: 2015 Aug – Oct. Airyx & Envimeas : 2018 – present O3, OCIO and BrO data are in the process of being archived - please contact Richard Querel for data access. NO2 data is available via the "GET DATA" link. GET DATA: https://www-air.larc.nasa.gov/missions/ndacc/data.html?station=arrival.heights
-
Geomagnetic measurements were established in Antarctica in 1957 as part of the International Geophysical Year and have continued until present. Geomagnetic data have been recorded continuously but for a gap in the data from 1959 until 1963. Since 1963, the components of the Earth’s magnetic field (H, D & Z) and the large variations in this field associated with the arriving charged particles which produce magnetic storms and aurora, have in principle been recorded continuously, with the quality improving as various upgrades were done. The instruments are still located at Scott Base. Because the surface volcanic rocks at Scott Base are strongly magnetised, two other sites are used for repeat measurements of the Earth's magnetic field - Cape Evans (first measured by Scott’s expedition in 1911) and Lake Vanda (first measured in 1974). The magnetic field is remeasured at these sites approximately every five years. This research project forms part of a global network of observatory magnetometers which provide information for the variation of the Earth's geomagnetic field on global and regional scales. Three component recordings of geomagnetic field variations are made, analysed and transmitted to international databases and individual researchers as appropriate. In the 2011/2012 season, we recorded the magnetic field at the Weir site by Lake Vanda, but the site at Astro A is now inaccessible and probably underwater, because the lake level has risen. We established a backup site called C Granite, slightly north-east of Weir, and on the same side of the Onyx River as the refuge huts. In the 2016/17 season, we recorded the magnetic field and took absolute magnetic measurements at the Vanda Weir & Vanda Granite sites over a four-day time period. We also conducted a set of absolute magnetic measurements at the repeat magnetic measurement site at the Cape Evans Magnetic Hut. In the 2022/2023 season, we took absolute magnetic measurements at the Weir and Granite sites at Lake Vanda. In the 2023/2024 season, we took absolute magnetic measurements at the Cape Evans Magnetic Hut. GET DATA Lake Vanda, Cape Evans, Vanda Weir, Vanda Granite, Astro A, Minna Bluff (and other historic measurements from various sites): https://geomag.bgs.ac.uk/data_service/data/surveydata.shtml GET DATA Scott Base (Preliminary and Definitive data): https://imag-data.bgs.ac.uk/GIN_V1/GINForms2?observatoryIagaCode=SBA GET DATA Scott Base Repeat Measurements Dataset from 2009-Present: contact geomag@gns.cri.nz
-
Measurements of boundary layer concentration of ozone are made with insitu instruments that samples air continuously at Arrival Heights, Antarctica and is part of the NOAA Global Monitoring Surface Ozone Network. Original measurements at Arrival Heights were made with a Dasibi Environmental Corp in situ analyser. This was replaced with a TEI-49c in situ analyser. The TEI-49c is owned by NOAA and operated by NIWA at Arrival Heights until October 2023. In October 2023 operation of the TEI was transferred to the USAP Arrival Heights laboratory along with operational responsibility (between NOAA and USAP). This data set contains continuous UV photometric data of surface level ozone collected at 6m above ground level. Data records consist of UTC time, date, and processed ozone mixing ratio (parts per billion). Data is collected from global locations and is provided in 1 minute and 1 hour averages. Data are archived at the NOAA National Climatic Data Center (NCDC), but are produced and available from NOAA Earth System Research Laboratory (ESRL). Instrument timeline: - Dasibi 1997-2003 - TEI49c 2003 – October 2023 - TEI49i November 2023 -present at USAP Arrival Heights laboratory GET DATA: https://gml.noaa.gov/aftp/data/ozwv/SurfaceOzone/ARH/
-
Measurements of total column of ozone made with Dobson spectrophotometer that measures either direct or zenith scattered ultraviolet light. The instrument was established in September of 1989 at 77° 49.8'S, 166° 39.6'E. Additionally a Brewer spectrophotometer took total column ozone measurements at Scott from 1989 to 1996. From 1989 to 2006 the Dobson (ID 17) was operated in manual mode but had an electronic encoder and computer added in 2006 for recording measurements. The data acquisition system was upgraded in Febuerary 2015 at Lauder, NZ. It is now running the JMA automation system. The Dobson (instrument ID: D17) is shipped out for maintenance and intercomparison with regional standard Dobson in Melbourne approximately every 5 years. Data (for both Dobson and Brewer) is held internally by NIWA and in the NDACC database. Data is also archived in the ozone and UV data centre Toronto, “Raw” data are times and instrument settings for instrument readings. “Derived” data are column amounts of ozone. Time line: Dobson 1987 -present Brewer 1989-1996 GET DATA: https://www-air.larc.nasa.gov/missions/ndacc/data.html?station=arrival.heights#